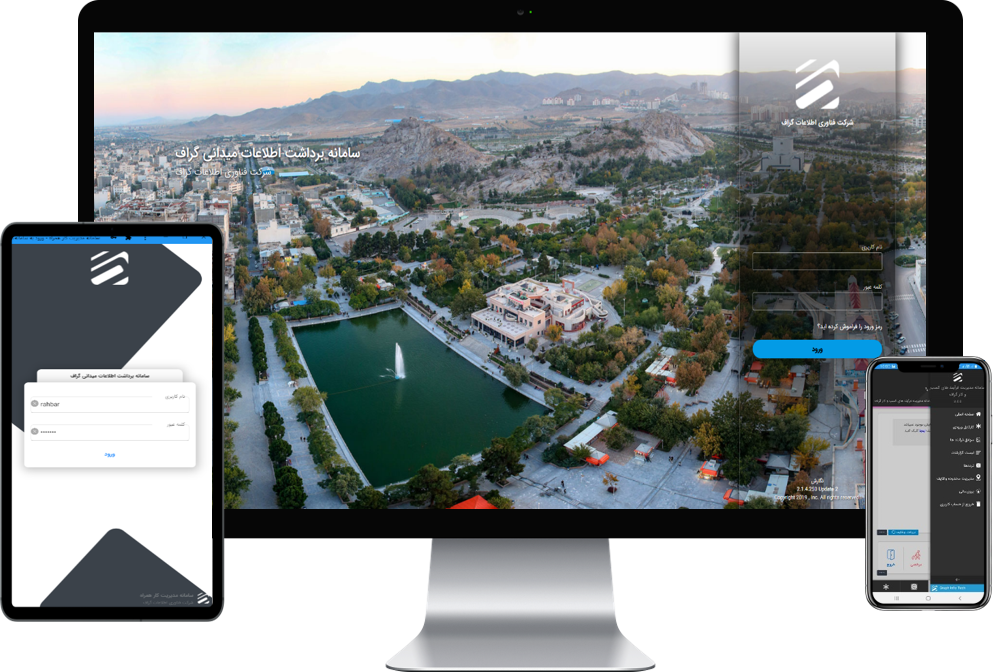
Graphorm
A complete solution for field data collection
Familiarize yourself with the facilities and features that graphorm gives you in collecting information.
Possibilities and features
Graphorm Easy data collection and real-time data monitoring.
The use of Graphorm accelerates the speed of information collection, provides reliable data, and at the same time empowers the external workforce and helps in optimal analysis of the collected information.
Offline registration
Synchronization of information in online and offline mode
Collect offline/online information
and the possibility of registering information online and offline
Collect data in the most remote places
Graphorm helps field agents or inspectors to complete their forms and reports on tablets and smart phones, even without connecting to the Internet, and collect information in offline mode. Since many areas are often not covered by the network. They are not suitable. Being in a remote location should not prevent you from doing your job.
Automatic synchronization
Captured data is stored locally and automatically synced when reconnected to the Internet.

Multilingual support
Support for several common languages of the world

Multilingual support
Support for several common languages of the world
Thanks to its multilingual support, Graphorm ensures that all its customers, regardless of their native language, culture or location, can get the most out of its products and services. With graphorm, information forms can be configured in defined languages, and in this way, all system facilities can be used according to the desired language..
Scientific and specialized translation
The translation of the Graphorm is completely scientific and based on specialized terms and words.
Platform without code
Create and manage information forms without programming knowledge
Platform without code
Without a single line of coding
Create your own custom forms
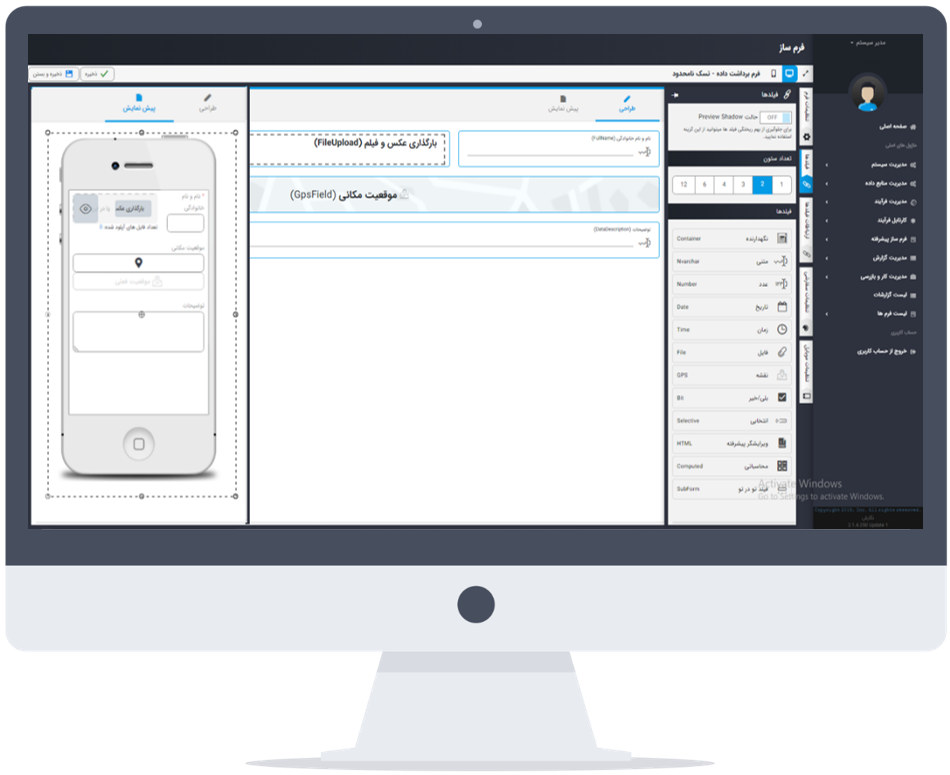
Using Graph's advanced form builder, create different forms without coding in a completely customized way and according to your business needs..
Design your workflow and execution process
Determine the roles and hierarchies and determine the workflow of your forms accordingly, then send the forms to the agent's mobile phone in the form of assigned tasks..
Calling various web services without programming (WSDL parser and REST Invoker)
Graphorm's advanced form builder
With customizable rules
Spatial form design
Create your own custom forms thanks to graphorm's flexible form builder.
Spatial form design
Specify rules and control rules for your form fields. Set logical relationships on your form and make your form intelligent by applying spatial controls.
Setting up form controls
Specify rules and control rules for your form fields. Set logical relationships on your form and make your form intelligent by applying spatial controls.
View a preview of the form
Preview your form before you share it.
Publication of field research form
Share the link of the form or distribute the form among the field personnel according to the designated accesses.
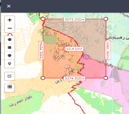
Scope of work
Management and control
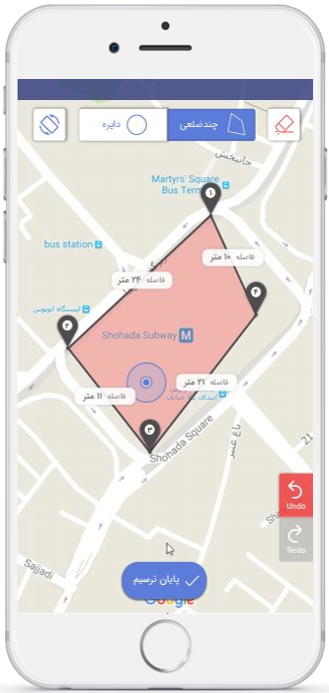
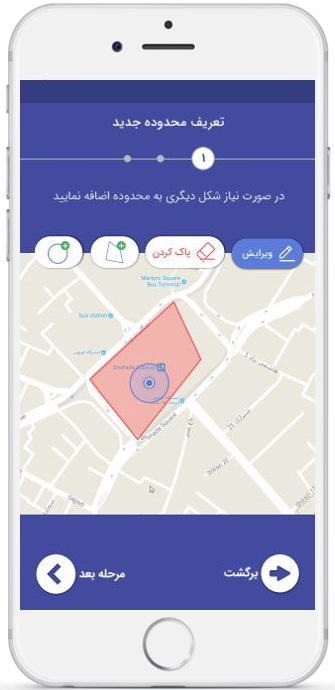
Determining the scope of work
Determining the type of harvest and scope of work
Circular harvest
Point withdrawal
Polygon extraction
square harvest
At the same time as specifying the permitted range of removal from the map, the accesses related to the desired range are applied.
Ability to record data
Location oriented
GIS Base location-based data registration
Saving the impression as GeoJSON and Geometry
Saving the impression as Geometry By activating this option, our location-based field (map field) is defined as Geometry on the database side, and all calculation functions related to Geometry topics are activated for use in the map..
Ability to automatically record the location of the inspector
In all forms that collect information with Graphorm, the location is automatically replaced by entering text in the address field.
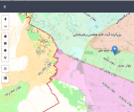
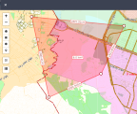
Create a spatial database
Viewing the results of all visits in all the defined areas Viewing the actions taken in the specified areas The possibility of recording the visit positions on the map Routing the visits through the map
Control the location and scope of information collection
By applying the necessary controls on the place and range of information collection, information forms will be able to be completed only within the designated range.
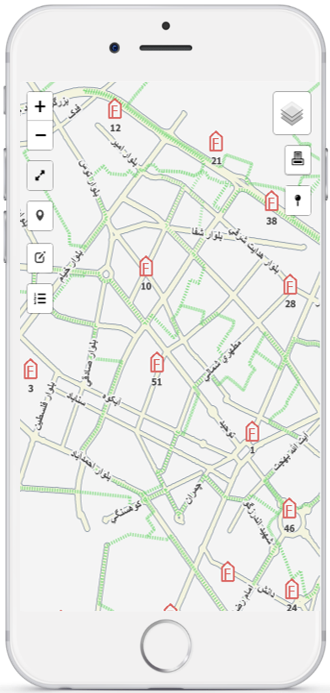
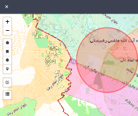
Definition and application
Base maps and custom map overlays
Ability to define and use dedicated map layers
Base maps and custom map overlays
Ability to define and select base maps (Base Map)
You can define all types of maps as the main map in the system and consider your favorite map as the Base Map among the defined maps. (such as: Mashhad map - Google map of Tehran and...)
The ability to add custom map overlays on the basic/main map (overlay)
Custom map overlays are add-ons that are placed on the main maps. Such as: location map of fire hydrant valves or map of train stations. You can apply custom map overlays on the main map of the system.
Multimedia
Collecting documents
Diversity in data collection
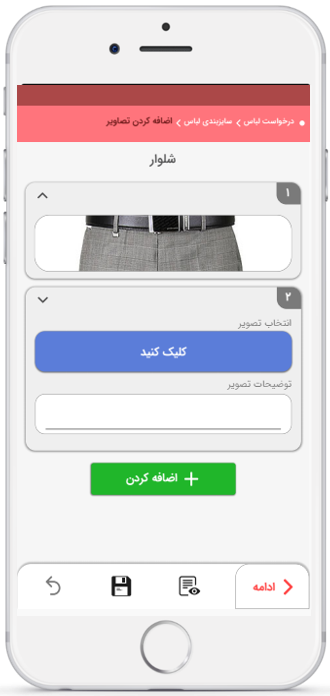
Easily record the details and attach your visit report
Graphorm helps you to collect all kinds of data in the form of multimedia formats in addition to collecting textual data in the results of your field research. With graphorm, allow the users of your form to attach multimedia files (including: image, sound or video, or even geographic location) to their submitted form..
Collect information in the form of images
Collect information in the form of video
Collect information in the form of sound
Collect information in the form of geographic location

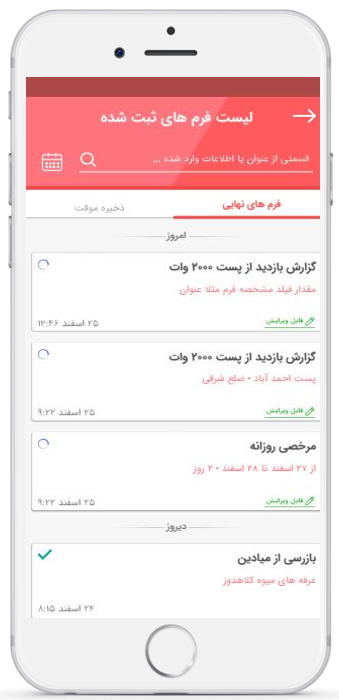
Always access to
Tasks and process folders

Graphorm helps you to collect all kinds of data in the form of multimedia formats in addition to collecting textual data in the results of your field research. With graphorm, allow the users of your form to attach multimedia files (including: image, sound or video, or even geographic location) to their submitted form..
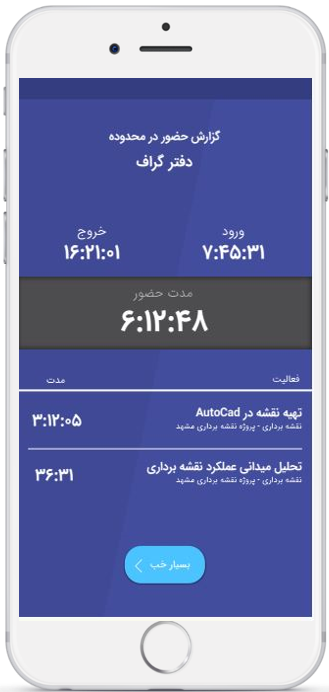
Clarity of people's duties
With Graphorm, people are fully aware of the time and place of doing work and the description of their task, and they know the due date and even the priority of their task well..
Clarity of roles in performing operations
With the Graphorm, each person is assigned a relevant role, and according to the applied workflow, the forms are circulated in the specified process..
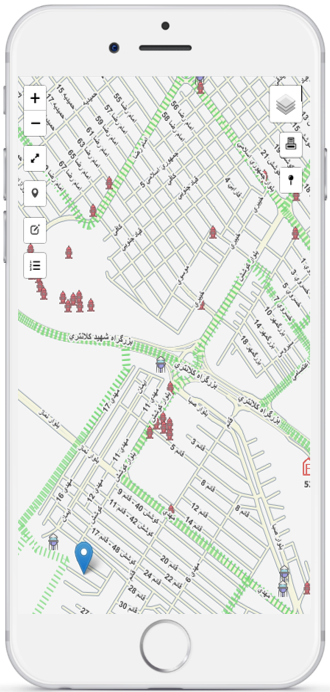
Manage scheduled and recurring tasks based on geographic location
Specified time and place
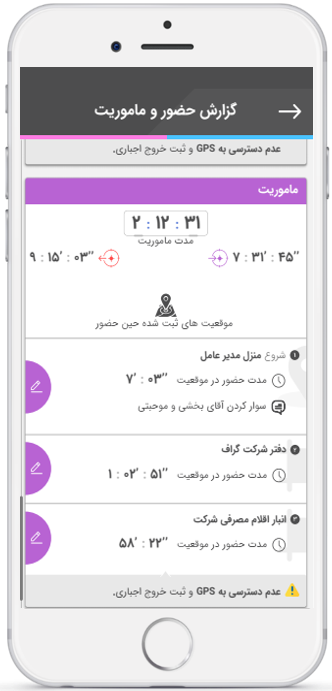
Controlling the presence of people
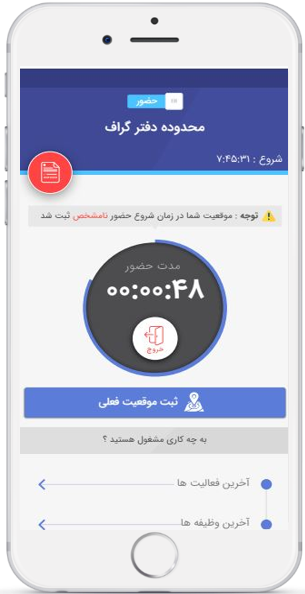
Traffic control and attendance of field personnel
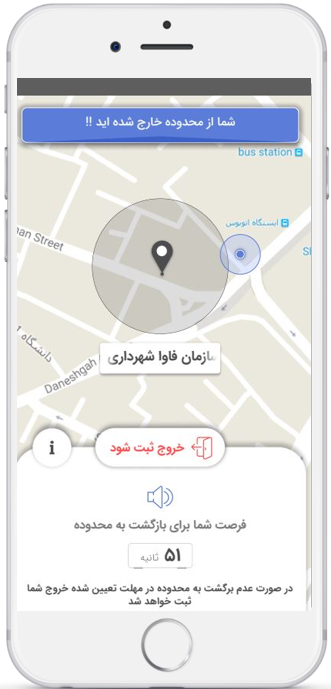
Controlling the movement of people based on the specified time and place
By applying the location settings, the Graphorm gives permission to collect information only in the designated geographical location, so that people will be able to collect and record their entry and exit status only by being in the specified location..
Tracking the route taken by the agent/inspector (Tracking)
Track the route taken by the workforce and follow the data collection process in real time.
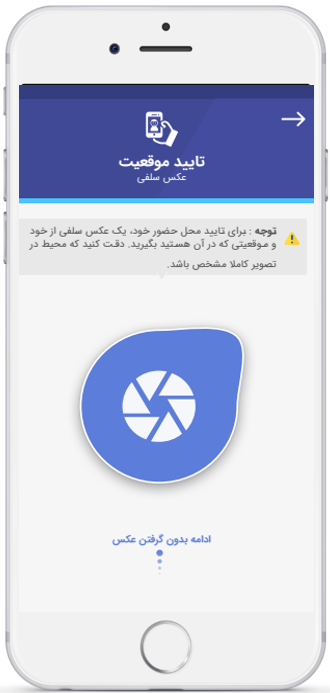
The possibility of presence and absence of field personnel based on image processing (Image Processing) based on geographical location

Location-based data collection
With any device
PWA web application
Collect location-based information with any type of device (IOS/Android/Desktop)
Graphorm is a multi-platform program made with PWA technology and due to its multi-platform nature, it works on all mobile operating systems (IOS/Android) or is available through computer browsers..
Can be used on all types of operating systems
Track the route taken by the workforce and follow the data collection process in real time.
It does not need to be installed
Mobile operating systems (IOS/Android) Desktop operating systems (Windows-Linux-Mac)
Updates are done automatically
Information web services
Automatic production
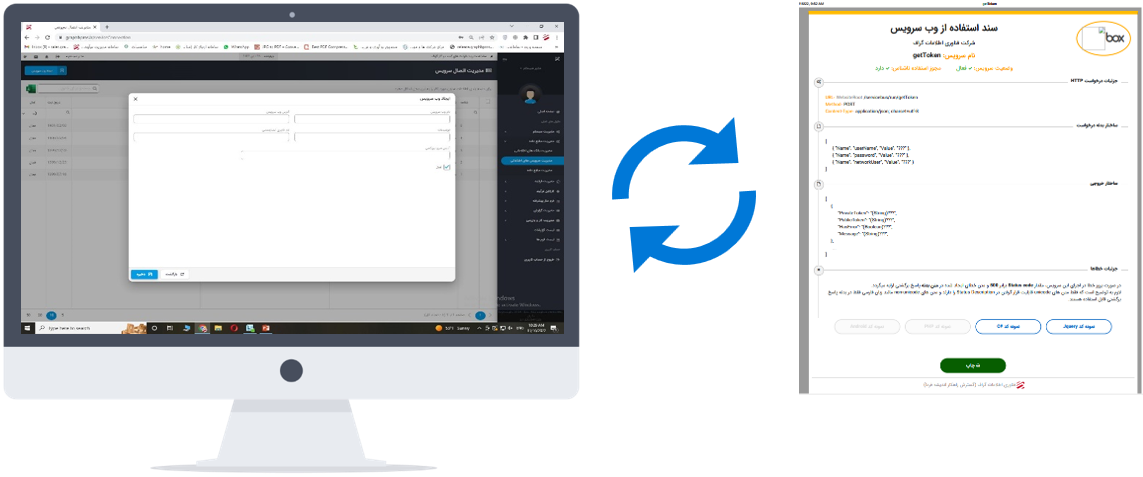
Automatic production of information web services
Service-oriented communication with existing software systems
Graphorm is an integrated software that can communicate with all software systems in your collection in a service-oriented manner and exchange data with them. graphorm is a definitive solution to solve the problem of communication with island software in field data collection operations.
Automatic presentation of web service usage document
Mechanized presentation of web service usage document (along with jquery code sample and c# code sample).
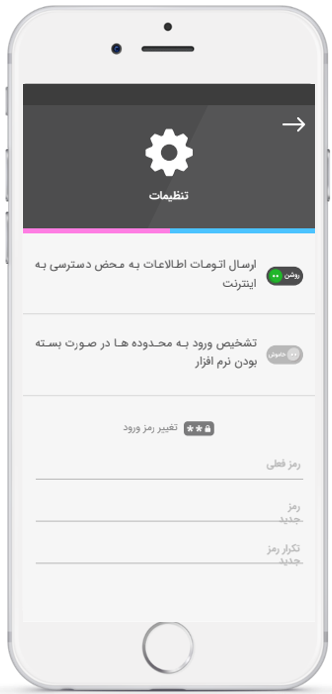
Momentary changes
In the structure of information collection forms
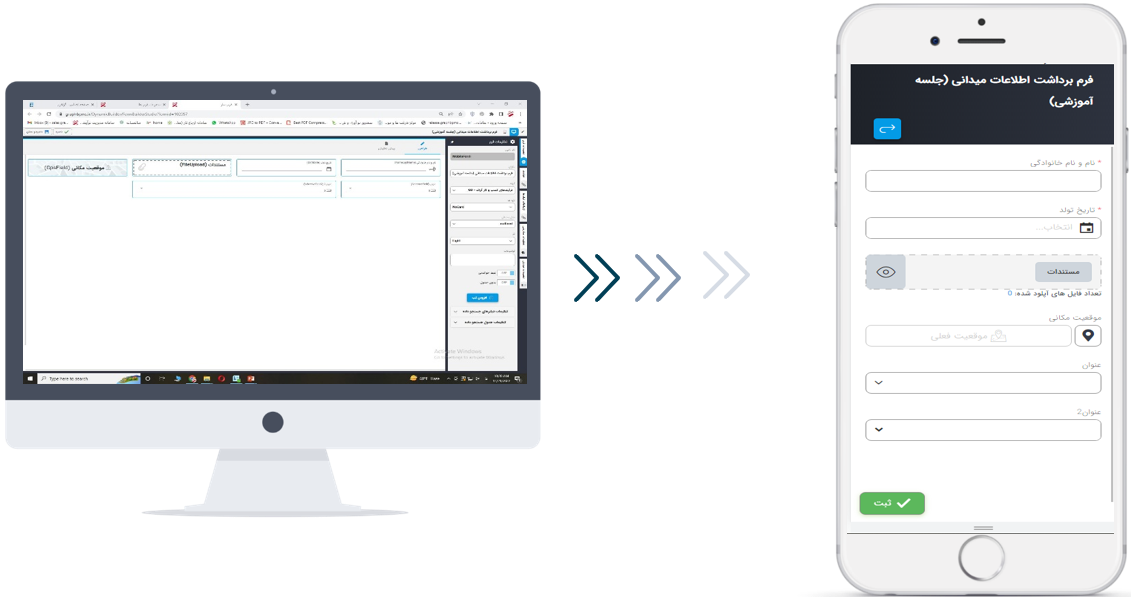
Applying momentary changes in the structure of information collection forms
Live access to the latest revision of forms and checklists
With graphorm, you can instantly and completely dynamically update the structure of previous forms' patterns..
Synchronization with the server allows the user to receive the latest version and changes of the forms automatically.
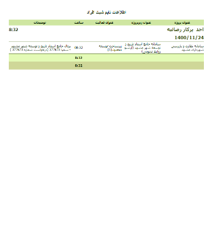
Advanced report builder
Create custom templates and reports
Create custom templates and reports
No programming knowledge required
Custom reports
Create simple or complex reports and provide them to relevant managers for decision making. You can add all kinds of formulas and calculation operators in your report and use the default templates to create the report..
Dynamic communication
For the selected fields, you can dynamically communicate with all kinds of services and view and edit different reports in your companion software.
Report output
Finally, the output of your report will be displayed in the form of graphs, designed forms and tables, and you can output your report in a variety of common formats..
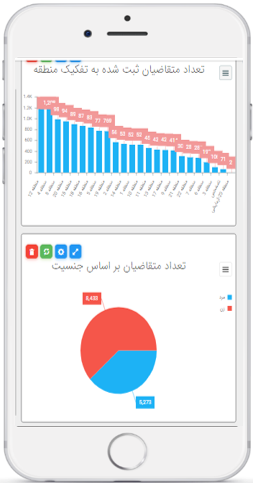
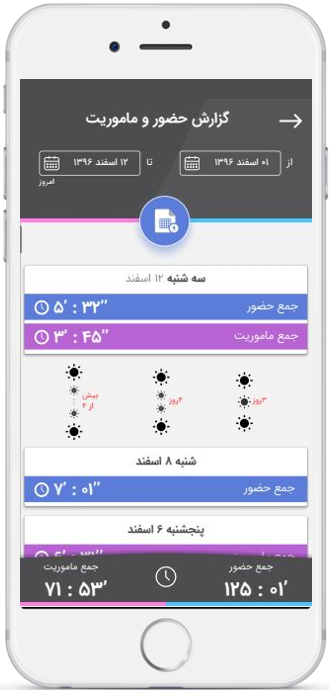
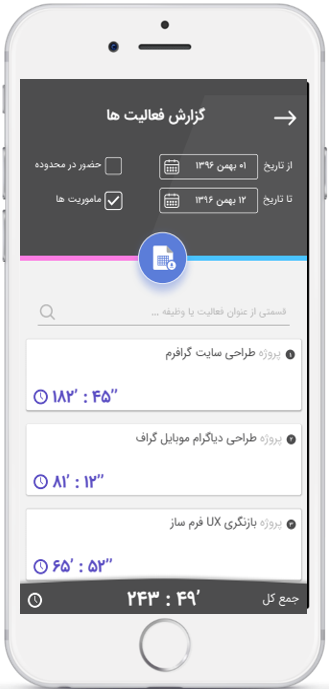
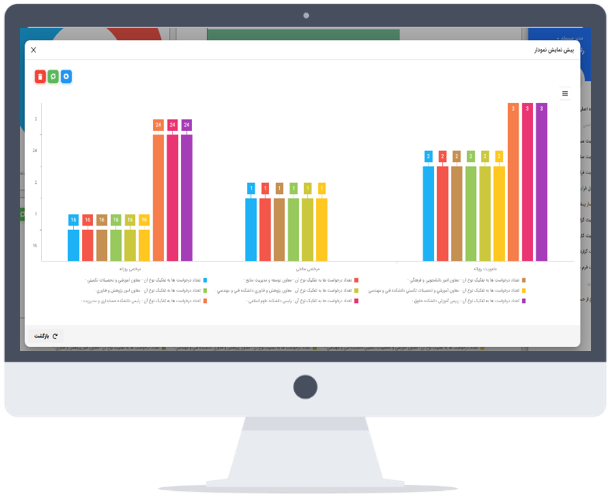
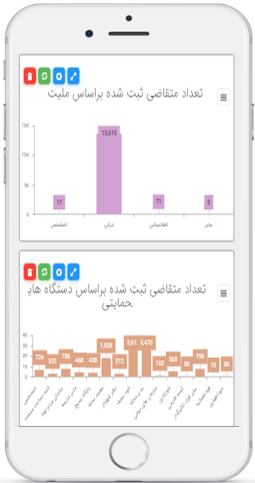
Management charts
Access to information dashboards anytime, anywhere
Custom reports
In the paper collection of information, in order to analyze and report, the information must be transferred from paper to the system, so sometimes the information loses its effectiveness in the effective time. have access and you will have them in your analyses.
Integrate information from different sources and get results on the dashboard
Integrate data from any source with captured data and create custom charts tailored to your business metrics.
Create custom dashboards and charts
Create your own custom dashboards and charts with your own layouts, colors, and annotations without coding..
Identify bottlenecks and inefficiencies in the organization's processes